updated below - 9/26/2016
Why is it...that journalists and people supposedly "in the know" don't do their research when they post economic data creating an environment of FALSE HOPE, when reporting the facts will help all of us work smarter?
Why Is It?
Ok, I admit it...I'M A NEWS JUNKIE!
The one thing I hate more than anything is when so called journalists create headlines that create false hope, only highlighting what "they" want their readers to know. 90%+ of the time, they hide the real facts....WHY IS IT do you think? Because some research clown says that we only want good news, or maybe news has to be entertaining, who knows? What I do know is that those people/companies that are well educated and focused on the "real world" are those companies succeeding
As you will quickly realize, I'm not a person that believes much of what I hear or what the news headlines try and report. I ALWAYS do my due diligence and search for the real data in order to contribute something meaningful. So with that said, you may want to stop reading the rest of this article, because what I'm about to report is NOT good for the retail economy.
Why would I be such a HERETIC.... you ask? Because I really care about retail, especially the home furnishing industry
- What is a Heretic you ask? It's a person holding an opinion at odds with what is generally accepted.

So here I go. The goal in reporting the truth behind the headlines is so retailers and brands can prepare for the "worst case scenario". If you prepare, you don't get ambushed, if you don't, consider yourself a statistic.
This is apolitical. As far as I'm concerned, most, if not all politicians, are not ethical and seem to be more interested in rhetoric and their reelection than addressing real problems surrounding our economy. They focus on social issues and forget the socio-economic crisis consumers are having that directly lead to consequences for brands and retailers.
First I'm going to show you the REAL state of the economy as it pertains to employment, then over 100 facts/links to show you that all is NOT good in our economy. The Government would like to claim that the recession is over, BUT they've been skewing the unemployment numbers since 1998 to NOT COUNT people who are chronically unemployed and not receiving any unemployment benefits. (REALLY...you use all your unemployment benefits, get kicked out of the system and you're not counted? Only with government accounting does this work)!
updated - 09/26/2016
26 Incredible Facts About The Economy That Every American Should Know
The mainstream media would have us believe that the U.S. economy is in pretty good shape. But is it actually true? The following are 26 incredible facts about the economy that every American should know.
#1 When Barack Obama entered the White House, the U.S. government was 10.6 trillion dollars in debt. Today, the U.S. government is 19.5 trillion dollars in debt, and Obama still has several months to go until the end of his second term. That means that an average of more than 1.1 trillion dollars will be added to the national debt during his presidency. We are stealing a tremendous amount of consumption from the future to make the economy look much, much better than it otherwise would be, and we are systematically destroying the future in the process.
#2 As Obama prepares to leave office, the rate at which we are adding to the national debt is actually increasing. During the fiscal year that is just ending, the U.S. government has added another 1.36 trillion dollars to the national debt.
#3 It isn’t just the federal government that is on a massive debt binge. Total U.S. corporate debt has nearly doubled since the end of 2007.
#4 Default rates on U.S. corporate debt are the highest that they have been since the last financial crisis.
#5 Corporate profits have fallen for five quarters in a row, and it is being projected that it will be six in a row once the final numbers for the third quarter come in.
#6 During the month of August, commercial bankruptcy filings were up 29 percentcompared to the same period a year ago.
#7 The rate of new business formation in the United States dropped dramatically during the last recession and has hovered at that new lower level ever since.
#8 The Wall Street Journal says that this is the weakest “economic recovery” since 1949.
#9 Barack Obama is on track to be the only president in all of U.S. history to never have a single year when the U.S. economy grew by at least 3 percent.
#10 In August, the Cass Freight Index dipped to the lowest level that we have seen for that month since 2010. What this means is that the total amount of stuff being shipped around the country by air, by rail and by truck is really dropping, and this is a clear sign that real economic activity is slowing down in a major way.
#11 Capital expenditure growth has turned negative, and history has shown that this is almost always followed by a new recession.
#12 The percentage of Americans with a full-time job has been sitting at about 48 percent since 2010. You have to go back to 1983 to find a time when full-time employment in this country was so low.
#13 The labor force participation rate peaked back in 1997 and has been steadily falling ever since.
#14 The “inactivity rate” for men in their prime working years is actually higher today than it was during the last recession.
#15 The United States has lost more than five million manufacturing jobs since the year 2000 even though our population has become much larger over that time frame.
#16 If you can believe it, the total number of government employees now outnumbers the total number of manufacturing employees in the United States by almost 10 million.
#17 One study found that median incomes have fallen in more than 80 percent of the major metropolitan areas in this country since the year 2000.
#18 According to the Social Security Administration, 51 percent of all American workers make less than $30,000 a year.
#19 The rate of homeownership in the U.S. has fallen every single year while Barack Obama has been in the White House.
#20 Approximately one out of every five young adults are currently living with their parents.
#21 The auto loan debt bubble recently surpassed the one trillion dollar mark for the first time ever.
#22 Auto loan delinquencies are at the highest level that we have seen since the last recession.
#23 In 1971, 61 percent of all Americans were considered to be “middle class”, but now middle class Americans have actually become a minority in this nation.
#24 One recent survey discovered that 62 percent of all Americans have less than $1,000 in savings.
#25 According to the Federal Reserve, 47 percent of all Americans could not even pay an unexpected $400 emergency room bill without borrowing the money from somewhere or selling something.
#26 The number of New Yorkers sleeping in homeless shelters just set a brand new record high, and the number of families permanently living in homeless shelters is up a whopping 60 percent over the past five years.
Why Is It Everyone Thinks The Unemployment Rate is 5.3% When It Is Not?
Unemployment
The government tells us that 8.69 million Americans are “officially unemployed” and that 92.90 million Americans are considered to be “not in the labor force”. That means that more than 101 million U.S. adults do not have a job right now.
You figure it out, I can't
- Why is it they say unemployment is 5.3%. How is that calculated when the BLS reports that 93,770,000 people (16 and older) were neither employed last month nor had made specific efforts to find work in the prior four weeks?
- The number of people outside the workforce in July increased 144,000 over June’s record when 93,626,000 were not in the workforce.
- July’s labor force participation rate however remained the same as June at 62.6 percent. Before last month the labor force participation rate had not been that low since October 1977, when the participation rate was 62.4 percent.
- The BLS reports that the civilian labor force did experience a slight uptick from 157,037,000 in June to 157,106,000 in July after the month of June saw it drop by 432,000.
- While the labor participation rate remains at the lowest it's been since the late 1970s, the BLS highlighted that the unemployment rate remained at 5.3 percent and nonfarm payroll jobs increased by 215,000.
You figure it out, I can't
Why Is It... Everyone States New Housing Starts Are At Record Levels, When They Are Not?
Home Ownership
Did you know that the rate of homeownership in the United States has fallen to a 20 year low? Did you know that it has been falling consistently for an entire decade? For the past couple of years, the economic optimists have been telling us that the economy has been getting better. Well, if the economy really has been getting better, why does the homeownership rate keep going down?
This is clearly demonstrated by the housing chart that I am about to share with you. If the economy really was healthy, more people would be getting good jobs and thus would be able to buy homes. But instead, the homeownership rate has continued to plummet throughout the entire “made up recovery”. I think that this chart speaks for itself…
This is clearly demonstrated by the housing chart that I am about to share with you. If the economy really was healthy, more people would be getting good jobs and thus would be able to buy homes. But instead, the homeownership rate has continued to plummet throughout the entire “made up recovery”. I think that this chart speaks for itself…
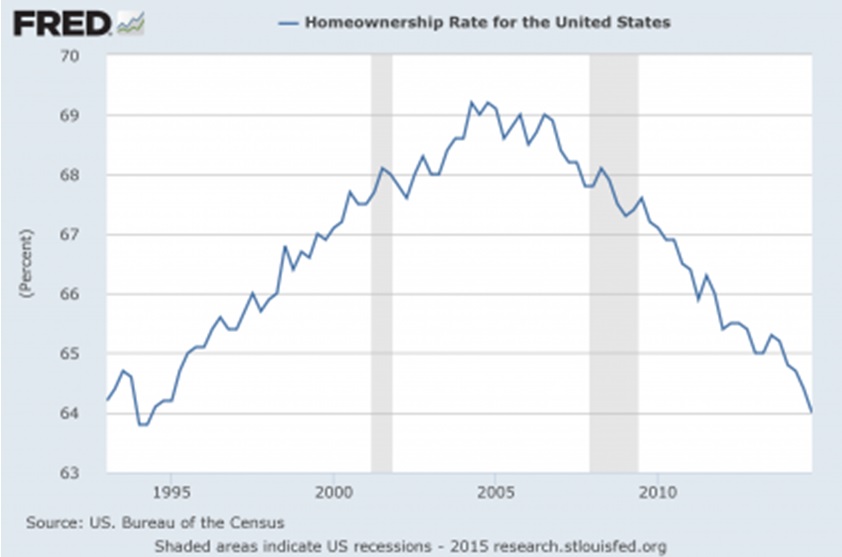
In early 2008, the homeownership rate in the U.S. was hovering around 68 percent. Today, it has plunged below 64 percent. Incredibly, it has not been this low in more than 20 years. Just look at this chart – the home-ownership rate has continued to plummet throughout the “economic recovery”…
If the U.S. economy truly was in “good shape”, the percentage of Americans that own homes would not be at a 20 year low…
If the U.S. economy truly was in “good shape”, the percentage of Americans that own homes would not be at a 20 year low…
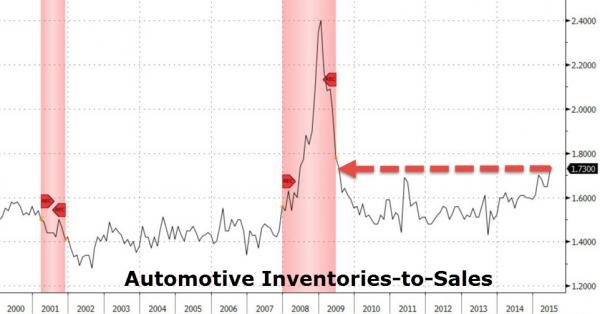
Why Is It.... Everyone States Automobile Sales Are At Record Levels, When They Are Not?
The Truth About Auto Sales
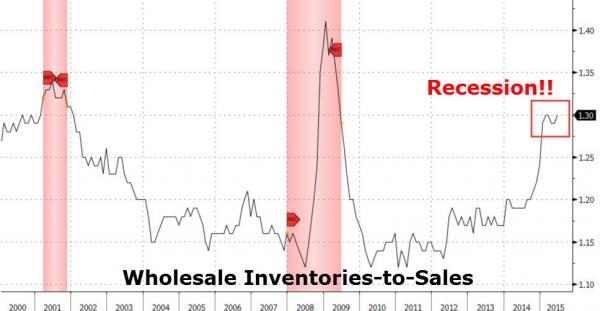
The ratio of wholesale inventories-to-sales pushed back up to 1.3 - its highest since the recession and is flashing an enormous red flag for an imminent recesion in America...
|
|
Most crucially, as The Atlanta Fed warns, "lower inventory investment will subtract 1.7ppt from Q3 real GDP growth." The higher Q2 'build' the worst Q3 will be - though we are sure economists will extrapolate Q2 growth no matter what...
|
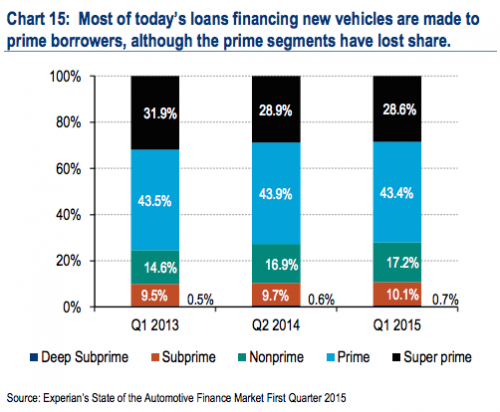
But here is what is very scary, the astounding fact that in Q4 2014, the average LTV for used vehicles hit 137%.
|
|
Why Is It....Everyone Says The Consumer Is "Back", When They Are Not?
The Consumer Hope Thing
One recent survey discovered that 55 percent of Americans believe that the American Dream either never existed or that it no longer exists.
Something has fundamentally gone wrong.
- After adjusting for inflation, median household income has fallen by nearly $5,000 since 2007.
- After adjusting for inflation, “the median wealth figure for middle-income families” fell from $78,000 in 1983 to $63,800 in 2013.
- At this point, 59 percent of Americans believe that “the American dream has become impossible for most people to achieve”.
- According to the Pew Research Center, close to four out of every ten households that are led by someone under the age of 40 are currently paying off student loan debt.
- Back in 1968, well over 50 percent of all Americans in the 18 to 31-year-old age bracket were already married and living on their own.
- But today, that number is actually below 25 percent. Instead, approximately 31 percent of all U.S. adults in the 18 to 34-year-old age bracket are currently living with their parents.
Something has fundamentally gone wrong.
Why Is It....No One Is Reporting On The Millenials CORRECTLY?
Everyone writes that this generation is the key HOPE thing for retail. Here are some interesting facts to get your head straight on this subject.
Have you heard? Millennials have the worst credit scores of any generation. The data point plays well with one of Americans’ favorite pastimes: discussing the dismal state of the nation’s youngest consumers.
The average 19- to 34-year-old has a credit score of 625, but it’s 650 for Gen X (35-49), 709 for baby boomers and the Greatest Generation (together, those generations include everyone older than 50). The national average is 667. The data comes from credit bureau Experian and uses the VantageScore 3.0 credit score range, which goes from 300 to 850.
#1 The current savings rate for Millennials is negative 2 percent. Yes, you read that correctly. Not only aren't Millennials saving any money, they are actually spending a good bit more than they are earning every month.
#2 A survey conducted earlier this year found that 47 percent of all Millennials are using at least half of their paychecks to pay off debt.
#3 For U.S. households that are headed up by someone under the age of 40, average wealth is still about 30 percent below where it was back in 2007.
#4 In 2005, the homeownership rate for U.S. households headed up by someone under the age of 35 was approximately 43 percent. Today, it is sitting at about 36 percent.
#5 One recent survey discovered that an astounding 31.1 percent of all U.S. adults in the 18 to 34-year-old age bracket are currently living with their parents.
#6 At this point, the top 0.1 percent of all Americans have about as much wealth as the bottom 90 percent of all Americans combined. Needless to say, there aren't very many Millennials in that top 0.1 percent.
#7 Since 2008 has been in the White House, close to 40 percent of all 27-year-olds have spent at least some time unemployed.
#8 Only about one out of every five 27-year-olds owns a home at this point, and an astounding 80 percent of all 27-year-olds are paying off debt.
#9 In 2013, the ratio of what men in the 18 to 29-year-old age bracket were earning compared to what the general population was earning reached an all-time low.
#10 Back in the year 2000, 80 percent of all men in their late twenties had a full-time job. Today, only 65 percent do.
#11 In 2012, one study found that U.S. families that have a head of household that is under the age of 30 have a poverty rate of 37 percent.
#12 Another study released back in 2011 discovered that U.S. households led by someone 65 years of age or older are 47 times wealthier than U.S. households led by someone 35 years of age or younger.
#13 Half of all college graduates in America are still financially dependent on their parents when they are two years out of college.
#14 In 1994, less than half of all college graduates left school with student loan debt. Today, it is over 70 percent.
#15 At this point, student loan debt has hit a grand total of 1.2 trillion dollars in the United States. That number has grown by about 84 percent just since 2008.
#16 According to the Pew Research Center, nearly four out of every ten U.S. households that are led by someone under the age of 40 are currently paying off student loan debt.
#17 In 2008, approximately 29 million Americans were paying off student loan debt. Today, that number has ballooned to 40 million.
#18 Since 2005, student loan debt burdens have absolutely exploded while salaries for young college graduates have actually declined…
The problem developing is that earnings and debt aren’t moving in the same direction. From 2005 to 2012, average student loan debt has jumped 35%, adjusting for inflation, while the median salary has actually dropped by 2.2%.
#19 According to CNN, 260,000 Americans with a college or professional degree made at or below the federal minimum wage last year.
#20 Even after accounting for inflation, the cost of college tuition increased by 275 percent between 1970 and 2013.
#21 In the years to come, much of the burden of paying for Medicare for our aging population will fall on Millennials. It is being projected that the number of Americans on Medicare will grow from 50.7 million in 2012 to 73.2 million in 2025. In addition, it has been estimated that Medicare is facing unfunded liabilities of more than 38 trillion dollars over the next 75 years. That comes to approximately $328,404 for every single household in the United States.
#22 In the years to come, much of the burden of paying for our exploding Medicaid system will fall on Millennials. Today, more than 70 million Americans are on Medicaid, and it is being projected that Obamacare will add 16 million more Americans to the Medicaid rolls.
#23 In the years to come, much of the burden of paying for our massive Ponzi scheme known as Social Security will fall on Millennials. Right now, there are more than 63 million Americans collecting Social Security benefits. By 2035, that number is projected to soar to an astounding 91 million. In 1945, there were 42 workers for every retiree receiving Social Security benefits. Today, that number has fallen to 2.5 workers, and if you eliminate all government workers, that leaves only 1.6 private sector workers for every retiree receiving Social Security benefits.
OUCH
So Now What?
I find it interesting that the Rent To Own sector in the home furnishing industry seems to be thriving....for now. Why is it you ask, my simple answer is that people can find $20.00 much easier than $500.00 all at once. Maybe the "value" isn't what it used to be, now it's the ability "to pay".
I've written countless articles on how retailers can compete, but I'm afraid it's fallen on deaf ears. WHY IS IT do you think companies like Bob's Furniture, Art Van and so many other regional power retailers are expanding? Because they are well capitalized and know how to get the consumers that are spending, at the expense of the small and medium sized retailer who still drives Oldsmobiles....looking for the dealership that no longer exists...to find spare parts.
So with that said....WHY IS IT retailers do not do research, absorb what's happening and prepare for war....war for that almighty sale/dollar, that are becoming fewer and far between....and it looks like it may get worse, before it gets better.