People Now Spend More Time Watching Their Phones Than Watching TV
Read more:
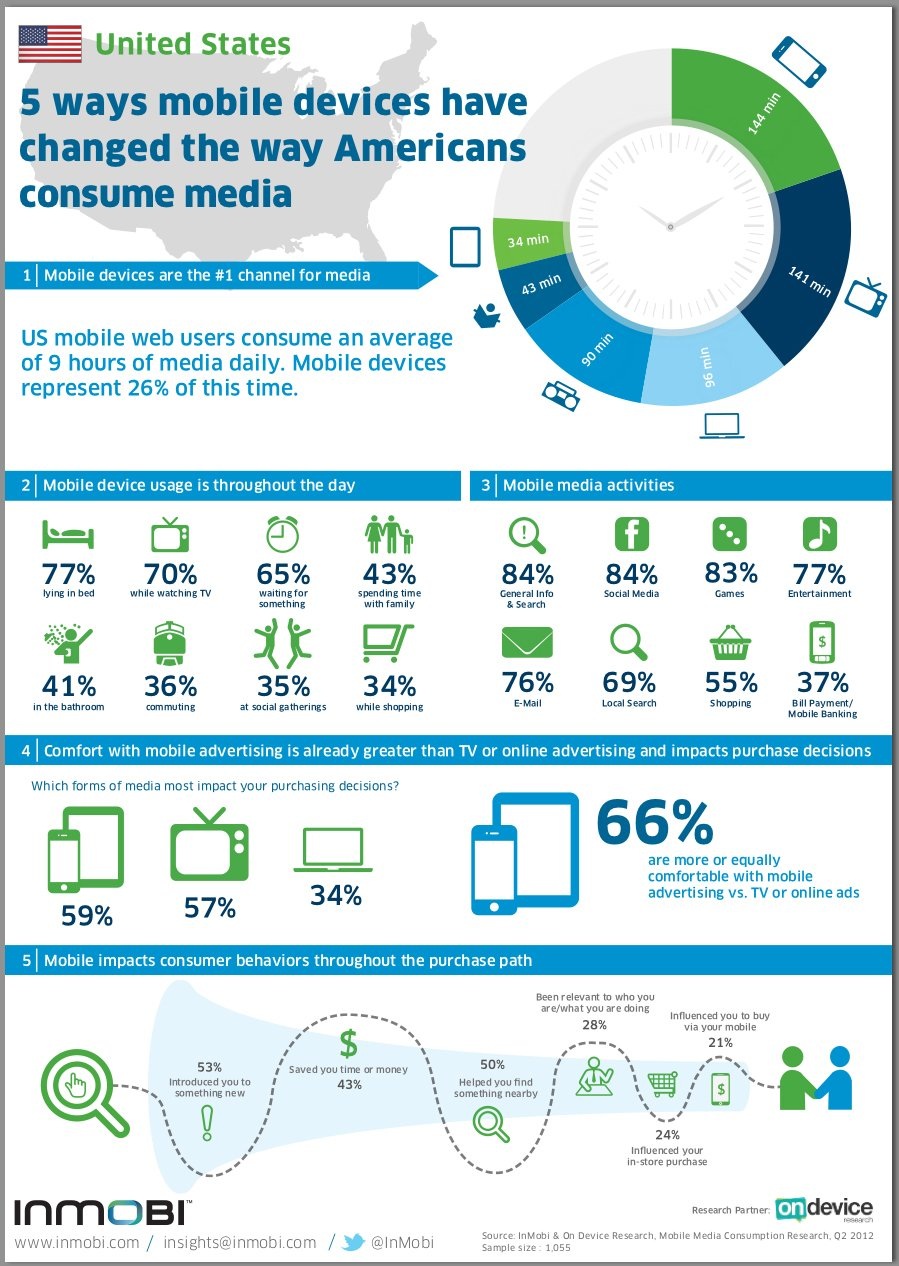
Could this be the moment that television officially lost its spot as America's favorite medium? A survey by InMobi, a mobile ad company, of 1,055 people asked how much time they spend interacting with all forms of media.
Users responded that they watched TV for 141 minutes a day. But they spent 144 minutes a day—26% of the nine hours they used various media—with their phones.
Users responded that they watched TV for 141 minutes a day. But they spent 144 minutes a day—26% of the nine hours they used various media—with their phones.
318,000 subscribers cut the cords on all their services, including cable TV, broadband internet, satellite and hard-wired phones.
This is for Q2 - 2012

Cable TV providers suffered the most. About 531,000 of them cut the cord. Another 62,000 people dumped their satellite dishes, but broadband providers added 275,000 customers, according to data from OneTouchIntelligence, a media research company.
In other words, the web is eating TV.
Q2 is always the worst quarter for TV and broadband companies. College students graduate and move in with their parents, or don't immediately get new cable service at their new homes. Many people choose to move house in the summer, and there is a delay in new TV hookups for that reason also. Business tends to bounce back in the fall.
But the declines are persistent: In Q2 2011, there were 330,000 lost subscribers; in Q2 2010 it was 143,000. So the Q2 declines have gotten, and stayed, deeper than they were two years ago.
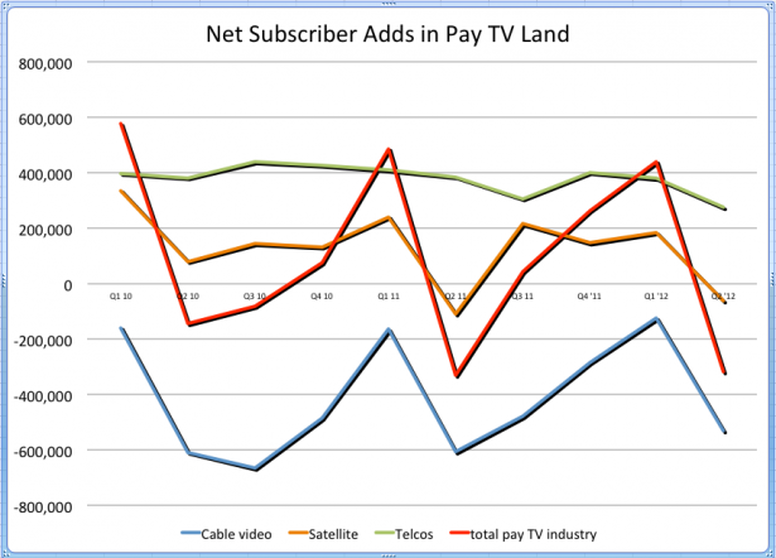
Here's a couple of charts showing what's going on. First, from OneTouchintelligence's data, are the net subscriber additions, broken out by medium:
Note that old-fashioned cable TV has consistently lost subscribers in every period of the last two years. Satellite is trending down, as are the telcos.
The red line represents the total industry as a whole.
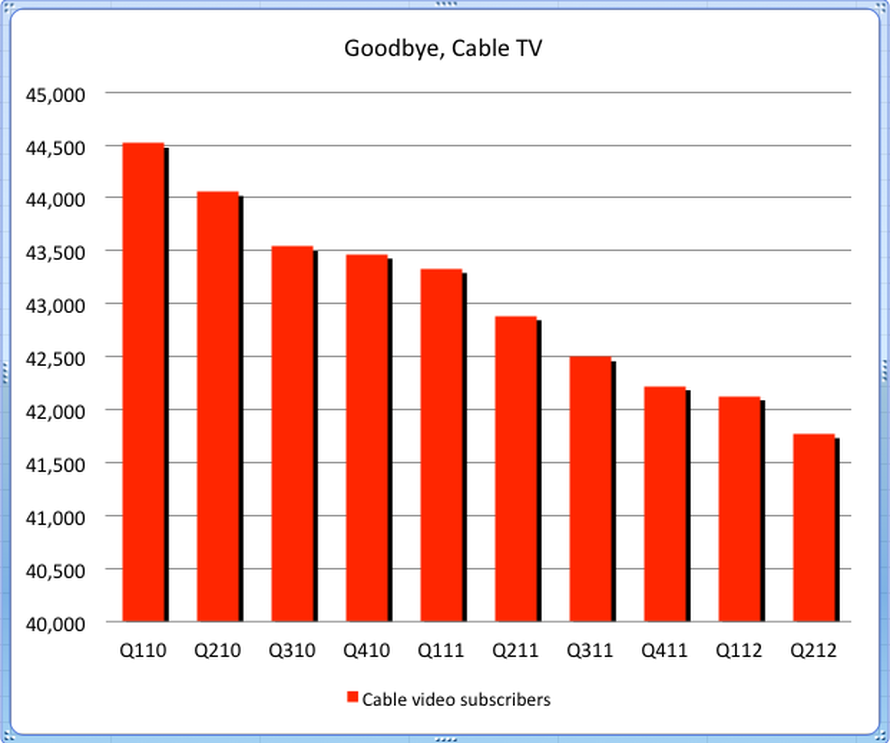
Now look at this chart, drawn from data provided by the analysts at ISI. It shows only total cable video subscribers across the category as a whole, and the numbers are in thousands:
The red line represents the total industry as a whole.
Now look at this chart, drawn from data provided by the analysts at ISI. It shows only total cable video subscribers across the category as a whole, and the numbers are in thousands:
It's important to note that the total universe of subscribers is actually growing slightly. But that growth isn't coming from cable TV. It's coming from telco companies and broadband companies.
In other words, the web is eating TV.
Read more:
In other words, the web is eating TV.
Read more:


