13 Tips To Create The Best Infographic Content For Your Online Business
Walls of text with no images or breaks are out of date.
Currently, users are inundated with tons of information daily, making catching their attention increasingly difficult.
There are, however, some strategies and types of content that have been proven effective to achieve this goal.
Infographics, for example, can grab the user's attention and convey a lot of information in an eye-catching and enjoyable way.
In order to achieve these results, you must create infographics following some of the best practices.
Continue reading if this sounds interesting to you. Throughout this article, we'll provide you with 13 tips for creating the best infographic content for your online business.
Let's jump in right away.
What is an infographic?
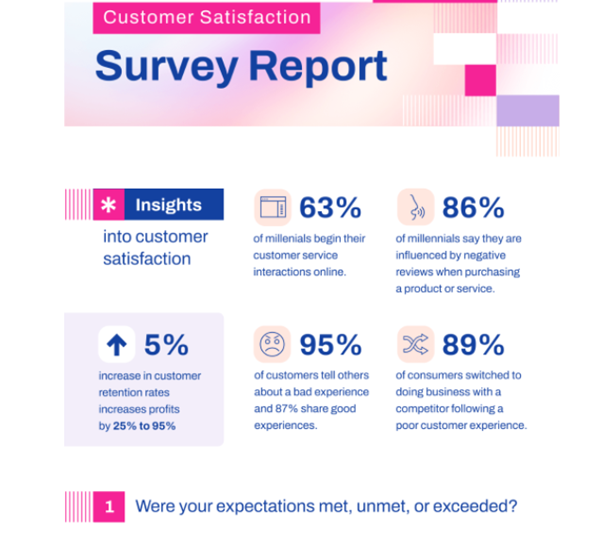
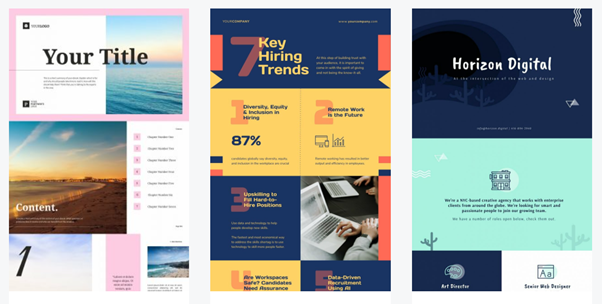
An infographic consists of imagery, data representations, such as charts and graphics, and text that gives an easy-to-understand and pleasant overview of a specific topic.
What are the benefits of creating an infographic?
Infographics offer several advantages that may inspire you to create one.
Before moving on to the benefits, the following statistics may shed some light on the importance of creating infographics:
Following these statistics that outline the impact of infographics on readers and viewers, here is a list of points that show how infographics can benefit your online business:
What are the benefits of creating an infographic?
Infographics offer several advantages that may inspire you to create one.
Before moving on to the benefits, the following statistics may shed some light on the importance of creating infographics:
- Among content creators, 40% stated that original visuals drove the most engagement in their marketing efforts.
- Researchers found that when visuals, color, and charts were used, the number of times a task took to find crucial information dropped by 39%.
- According to experts, infographics enhance reading comprehension by 50%.
Following these statistics that outline the impact of infographics on readers and viewers, here is a list of points that show how infographics can benefit your online business:
- You could easily make your infographic go viral and boost your brand awareness.
- A captivating infographic encourages visitors to spend more time on your website.
- Using infographics will improve your ranking in Google image searches.
13 best tips to create outstanding infographic content
Having learned all the benefits and advantages visual materials can bring to your business, it's now time to learn how to make infographics truly impressive.
The following are 13 best tips for producing outstanding infographics.
1. Pick content that might interest your target audienceCreating an infographic begins with taking into consideration the content you want to develop and turn into a visual.
Consider a topic that does not pertain to your target audience, and you will not get the results you want.
It is important for you to do some research before beginning the creation process. Better yet, conduct surveys and ask directly to your clients or audience what topics they'd like you to cover in an infographic.
2. Write an eye-catching and persuasive headline
|
Visual content can attract users' attention and interest more easily than text. Today, however, the internet and social media are saturated with visual content. As a result, you should go one step further to ensure your infographic gets noticed.
Writing an eye-catching and persuasive headline is one way to accomplish this. A few tips for a successful headline include:
|
3. Use colors and styles that reflect your brand
It is important that people can immediately associate your infographic with your brand identity. By doing so, you can build a stronger brand reputation among your clients and users.
You can accomplish this by using colors, fonts, and styles that you've already used on your site.
In addition, ensure your logo and company name are visible in the infographic.
If you decide not to use the colors of your brand or if you decide to use them partially, you should also consider the feelings that the colors you choose inspire.
Each color can evoke different emotions, as you may already know. A black color for instance inspires elegance, while a green color encourages creativity.
Additionally, you should choose colors that work well together. You can achieve this by using a pre-made color palette, such as the ones provided by Colorhunt.
4. Include eye-catching imagesThe term infographic does not apply to an infographic without images or visuals. Also, it won't be nearly as engaging.
By using images in your infographic, you can help comprehension more and make it more visually appealing.
However, putting images doesn't mean randomly choosing stock images.
Instead, make sure they serve a purpose well. You can, for instance, use images rather than just words to explain a concept.
Additionally, the images should be high resolution, well-visible, and of the right size.
5. Inspire professionalism with charts, statistics, graphics, and more
|
In some cases, information and content alone will not be able to convince the reader about your claims.
Statistical evidence will help you to present a stronger point to your information and invoke a sense of professionalism among your readers. For this reason, ensure that they follow the percentage statements closely. You can also present them in the form of charts or graphics to make them more appealing. 6. Do not go overboard: keep it simpleWhen you overload your infographic with images, text, and charts, the result will be cluttered and difficult to read. Rather than grabbing the users' attention, this will cause them to ignore it. |
Because of this, you should simplify your infographic as much as possible. You should try to keep the text short and simple.
In addition, use only images and charts that add real value to your content, not just those that are visually appealing.
7. Ensure it is readable and aesthetically pleasing
An infographic is generally a long-form visual. Therefore, some content may not be visible or unclear in its entirety.
Therefore, it is your responsibility to make sure the text, images, and charts remain visible and are clearly readable.
You need to use a readable font and make it the right size to ensure this. You also need to make sure images and charts are visible and comprehensible in different shapes and sizes.
If you want this flexibility, make your infographic responsive. This way, it'll automatically adjust to any screen size.
8. Utilize white space effectively
|
Even if you present a lot of information in your infographic, it must be well-organized and structured. A confusing and messy visual content will not yield the results you are looking for.
Thus, use white space wisely, divide each section clearly, and make sure you follow a logic structure. |
9. Include your details at the end (website URL, email, etc.)Creating an infographic is also a great way to promote your business. In light of this, it is essential to sign it with your logo, as well as perhaps your email address or the URL of your website.
By doing this, users will know where the infographic comes from if it becomes viral. It is also an effective way for you to generate leads and increase brand awareness.
10. Concentrate on and follow a logic flow
By doing this, users will know where the infographic comes from if it becomes viral. It is also an effective way for you to generate leads and increase brand awareness.
10. Concentrate on and follow a logic flow
|
It is possible to view an infographic as a story as well. It's a way to bring together a lot of useful information into a visually appealing format.
Therefore, there must be a connection between content topic and visual type in the different sections of your infographic. Having a flow will help you keep the readers' attention and keep them reading throughout your visual piece. For example, you can number each section so that users know which path to follow. It is also possible to use zigzags or snake-like patterns instead of numbers. To make clear the division among the sections, you can also play with colors and images. |
11. Focus on just one topic
Although you may be tempted to include more topics within your infographic, you shouldn't because it might confuse users and make it difficult for them to understand.
Instead, by focusing on a single topic, you can go into greater detail and ensure your readers understand what your content is about and leave them with useful information.
12. Don't forget to include a call to action
At the end of the day, you share content to accomplish a specific goal, whether it is to increase brand awareness, website traffic, or sales.
In this situation, it's important to emphasize it at the end of the infographic or in the text that accompanies it.
Call to actions should be strong; "Talk to us" or "Download it now" are good examples.
You can also include a URL that users can easily click in addition to a call-to-action.
13. Make your infographic shareable
Sharing and gaining visibility for your infographic is surely something you want. The format plays an important role in this. Sharing some formats can be more challenging than others.
Rather, formats like PDF are some of the best you can use. They are easy to download and to share across all platforms.
Wrapping up
It is getting increasingly difficult to grab users’ attention and gain visibility online.
It is possible, however, to aid this intention with some content practices and formats. One such format is the infographic.
In this blog post, we have explained what it is, its benefits, and some of the best tips to create one that is effective and brings positive results in terms of visibility and engagement.
No matter how much experience or knowledge you or your team has in design, you can implement and apply them easily.
Thank you for taking the time to read this article. Hopefully, you found it helpful.
If you want to read more about the topic, check out this guide on how to use content marketing to improve brand awareness.
|
About The Author Flavia Silipo is a skilled SEO copywriter and digital marketing specialist with over two years of experience. You can find her on LinkedIn. |


